python庫skimage給灰度圖像染色的方法示例
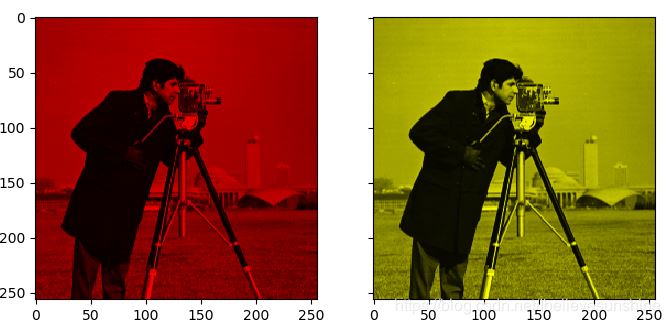
灰度圖像染成紅色和黃色
# 1.將灰度圖像轉換為RGB圖像image = color.gray2rgb(grayscale_image)# 2.保留紅色分量和黃色分量red_multiplier = [1, 0, 0]yellow_multiplier = [1, 1, 0]# 3.顯示圖像fig, (ax1, ax2) = plt.subplots(ncols=2, figsize=(8, 4),sharex=True, sharey=True)ax1.imshow(red_multiplier * image)ax2.imshow(yellow_multiplier * image)
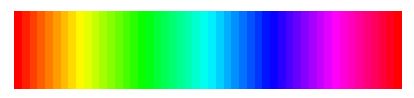
HSV圖像,H從0到1表示的顏色
hue_gradient = np.linspace(0, 1)# print(hue_gradient.shape) # output:(50,)hsv = np.ones(shape=(1, len(hue_gradient), 3), dtype=float)hsv[:, :, 0] = hue_gradientall_hues = color.hsv2rgb(hsv)fig, ax = plt.subplots(figsize=(5, 2))# Set image extent so hues go from 0 to 1 and the image is a nice aspect ratio.ax.imshow(all_hues, extent=(0, 1, 0, 0.2))ax.set_axis_off()
將灰度圖像染成不同的顏色
hue_rotations = np.linspace(0, 1, 6)fig, axes = plt.subplots(nrows=2, ncols=3, sharex=True, sharey=True)for ax, hue in zip(axes.flat, hue_rotations): # Turn down the saturation to give it that vintage look. tinted_image = colorize(image, hue, saturation=0.3) ax.imshow(tinted_image, vmin=0, vmax=1) ax.set_axis_off()fig.tight_layout()

完整代碼
'''=========================Tinting gray-scale images=========================It can be useful to artificially tint an image with some color, either tohighlight particular regions of an image or maybe just to liven up a grayscaleimage. This example demonstrates image-tinting by scaling RGB values and byadjusting colors in the HSV color-space.In 2D, color images are often represented in RGB---3 layers of 2D arrays, wherethe 3 layers represent (R)ed, (G)reen and (B)lue channels of the image. Thesimplest way of getting a tinted image is to set each RGB channel to thegrayscale image scaled by a different multiplier for each channel. For example,multiplying the green and blue channels by 0 leaves only the red channel andproduces a bright red image. Similarly, zeroing-out the blue channel leavesonly the red and green channels, which combine to form yellow.'''import matplotlib.pyplot as pltfrom skimage import datafrom skimage import colorfrom skimage import img_as_floatgrayscale_image = img_as_float(data.camera()[::2, ::2])image = color.gray2rgb(grayscale_image)red_multiplier = [1, 0, 0]yellow_multiplier = [1, 1, 0]fig, (ax1, ax2) = plt.subplots(ncols=2, figsize=(8, 4),sharex=True, sharey=True)ax1.imshow(red_multiplier * image)ax2.imshow(yellow_multiplier * image)####################################################################### In many cases, dealing with RGB values may not be ideal. Because of that,# there are many other `color spaces`_ in which you can represent a color# image. One popular color space is called HSV, which represents hue (~the# color), saturation (~colorfulness), and value (~brightness). For example, a# color (hue) might be green, but its saturation is how intense that green is# ---where olive is on the low end and neon on the high end.## In some implementations, the hue in HSV goes from 0 to 360, since hues wrap# around in a circle. In scikit-image, however, hues are float values from 0# to 1, so that hue, saturation, and value all share the same scale.## .. _color spaces:# https://en.wikipedia.org/wiki/List_of_color_spaces_and_their_uses## Below, we plot a linear gradient in the hue, with the saturation and value# turned all the way up:import numpy as nphue_gradient = np.linspace(0, 1)# print(hue_gradient.shape) # output:(50,)hsv = np.ones(shape=(1, len(hue_gradient), 3), dtype=float)hsv[:, :, 0] = hue_gradientall_hues = color.hsv2rgb(hsv)fig, ax = plt.subplots(figsize=(5, 2))# Set image extent so hues go from 0 to 1 and the image is a nice aspect ratio.ax.imshow(all_hues, extent=(0, 1, 0, 0.2))ax.set_axis_off()####################################################################### Notice how the colors at the far left and far right are the same. That# reflects the fact that the hues wrap around like the color wheel (see HSV_# for more info).## .. _HSV: https://en.wikipedia.org/wiki/HSL_and_HSV## Now, let’s create a little utility function to take an RGB image and:## 1. Transform the RGB image to HSV 2. Set the hue and saturation 3.# Transform the HSV image back to RGBdef colorize(image, hue, saturation=1): ''' Add color of the given hue to an RGB image. By default, set the saturation to 1 so that the colors pop! ''' hsv = color.rgb2hsv(image) hsv[:, :, 1] = saturation hsv[:, :, 0] = hue return color.hsv2rgb(hsv)####################################################################### Notice that we need to bump up the saturation; images with zero saturation# are grayscale, so we need to a non-zero value to actually see the color# we’ve set.## Using the function above, we plot six images with a linear gradient in the# hue and a non-zero saturation:hue_rotations = np.linspace(0, 1, 6)fig, axes = plt.subplots(nrows=2, ncols=3, sharex=True, sharey=True)for ax, hue in zip(axes.flat, hue_rotations): # Turn down the saturation to give it that vintage look. tinted_image = colorize(image, hue, saturation=0.3) ax.imshow(tinted_image, vmin=0, vmax=1) ax.set_axis_off()fig.tight_layout()####################################################################### You can combine this tinting effect with numpy slicing and fancy-indexing# to selectively tint your images. In the example below, we set the hue of# some rectangles using slicing and scale the RGB values of some pixels found# by thresholding. In practice, you might want to define a region for tinting# based on segmentation results or blob detection methods.from skimage.filters import rank# Square regions defined as slices over the first two dimensions.top_left = (slice(100),) * 2bottom_right = (slice(-100, None),) * 2sliced_image = image.copy()sliced_image[top_left] = colorize(image[top_left], 0.82, saturation=0.5)sliced_image[bottom_right] = colorize(image[bottom_right], 0.5, saturation=0.5)# Create a mask selecting regions with interesting texture.noisy = rank.entropy(grayscale_image, np.ones((9, 9)))textured_regions = noisy > 4# Note that using `colorize` here is a bit more difficult, since `rgb2hsv`# expects an RGB image (height x width x channel), but fancy-indexing returns# a set of RGB pixels (# pixels x channel).masked_image = image.copy()masked_image[textured_regions, :] *= red_multiplierfig, (ax1, ax2) = plt.subplots(ncols=2, nrows=1, figsize=(8, 4),sharex=True, sharey=True)ax1.imshow(sliced_image)ax2.imshow(masked_image)plt.show()####################################################################### For coloring multiple regions, you may also be interested in# `skimage.color.label2rgb http://scikit-# image.org/docs/0.9.x/api/skimage.color.html#label2rgb`_.

到此這篇關于python庫skimage給灰度圖像染色的方法示例的文章就介紹到這了,更多相關python 灰度圖像染色內容請搜索好吧啦網以前的文章或繼續瀏覽下面的相關文章希望大家以后多多支持好吧啦網!
相關文章:
1. Python獲取抖音關注列表封號賬號的實現代碼2. Warning: require(): open_basedir restriction in effect,目錄配置open_basedir報錯問題分析3. php網絡安全中命令執行漏洞的產生及本質探究4. 解決Python 進程池Pool中一些坑5. php測試程序運行速度和頁面執行速度的代碼6. Python如何讀寫CSV文件7. 三個不常見的 HTML5 實用新特性簡介8. ajax請求添加自定義header參數代碼9. python利用os模塊編寫文件復制功能——copy()函數用法10. 無線標記語言(WML)基礎之WMLScript 基礎第1/2頁

 網公網安備
網公網安備